I'm afraid that that's similar to what I'm looking for but different enough that it won't suit my needs without extensive manual tweaking after each run (although it is possible my confusion comes from the way your jobs are named):
You have multiple entries for the same VM from what seems to be the same backup job (lines 1, 2, 4, & 6)
You have a single entry for multiple jobs (line 2)
Because it's run on a VM basis, I'm going to have to export the results this report as well as the results from the "Job Configuration Dump" report, paste them both into a spreadsheet (or maybe a database), and come up with a formula/query to combine the information from the two
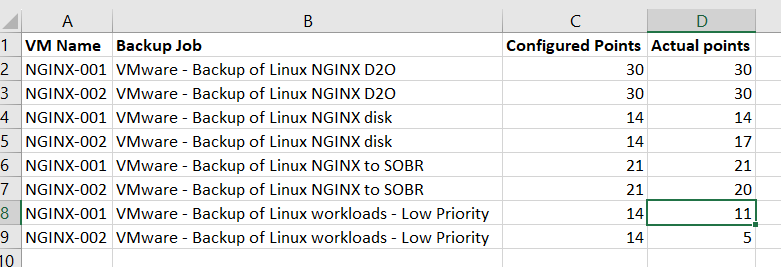
What I'm looking for is something more akin to this (apologies that it's not pretty, but an Excel mockup is easier than a full report mockup):
![Image]()
Once I have that data, I can easily apply formatting that will show me jobs that have exceeded their configured points and servers that don't have enough points.
You have multiple entries for the same VM from what seems to be the same backup job (lines 1, 2, 4, & 6)
You have a single entry for multiple jobs (line 2)
Because it's run on a VM basis, I'm going to have to export the results this report as well as the results from the "Job Configuration Dump" report, paste them both into a spreadsheet (or maybe a database), and come up with a formula/query to combine the information from the two
What I'm looking for is something more akin to this (apologies that it's not pretty, but an Excel mockup is easier than a full report mockup):
Once I have that data, I can easily apply formatting that will show me jobs that have exceeded their configured points and servers that don't have enough points.
Statistics: Posted by RubinCompServ — Dec 31, 2023 6:23 pm
![Chad Lawson – Awakening: The Stillness Within (2026) [FLAC 24bit/48kHz]](http://imghd.xyz/images/2026/05/09/x5d03jw9bi367_600.jpg)